
 Supplied — EJ Hersom
It seems to be a foregone conclusion that Washington’s Braden Holtby is going to win the Vezina Trophy for the NHL’s best goaltender this season. I mean, why not, right? The Capitals are far and away the league’s best team, he’s been a huge part of their success, and he’s only three victories away from tying Martin Brodeur’s record for most wins by a goalie in a single season.
But the problem is, he hasn’t been the league’s best goalie this year. Don’t get me wrong, he’s been fantastic, but there have been goalies on vastly inferior teams to the Capitals who have simply been better. Unfortunately, these performances fly under the radar because the general rhetoric around what a good goalie is begins and ends with three stats: Wins, goals against average, and save percentage.
Wins are a team stat and don’t provide anything more than a basic indicator of the situation the goalie is playing in. Same goes for goals against average, which simply provides us with intel on how many goals the team allows while that goaltender is playing. Save percentage finally starts to dig into how good they perform in relation to their workload, but can be misleading based on the quality of shots taken. Sure, these numbers are a nice and basic way to see which goalies are playing well, but none of them take into consideration how they play in certain situations, or whether they’re the benefactor of a good team that makes their life easy on a game to game basis or the hero that compensates for terrible defence.
In order to figure out who the best goalies are, we need to dig a lot deeper than just the amount of saves they make divided by the total number of shots they face. Is a save made on a soft wrist shot from just above the face-off circle the same as one made on a one-timer in front of the net? According to save percentage, yes, they’re the exact same thing. How about a goal allowed in the first period of a game in which the team is already winning by four? Is that goal the same as one allowed in the dying seconds of a tie game while on the penalty kill? Absolutely not. Not all shots are made equal. Some are more difficult than others, either because they’re taken at a more important time in the game or because they’re taken from a more dangerous part of the ice, so they need to be quantified accordingly.
There are three categories, or zones, in which a shot can come from. I won’t go into a tremendous amount of detail on how each of them was quantified, as it was work done by the fantastic hockey minds over at War-on-Ice.com, but I’ll gloss over what a shot from each of them looks like.
The Low Danger Zone is the perimeter and behind the net, where there’s less than a three per cent chance the shot will be on goal. This would be a soft write shot from the left point, or a quick shot from the boards off a broken rush. There’s a pretty good chance the shot will be blocked or it’ll miss the net from here, and if it does make it to the net, there’s a good chance the goalie had a fair amount of time to prepare for it.
The Medium Danger Zone is somewhat of an extended crease around the net, ranging from the centre blue line point, to the top of the slot, and over to each hashmarks in the face-off circles. This would be a slap shot from the point, or a wrist shot from the circles. You know, a pretty decent scoring chance. From here, there’s a significantly higher chance that the shot is going to make it to the net, and because of its close proximity, the goalie will likely won’t have much time to react.
The High Danger Zone is the small area immediately in front of the net. If you’re shooting from here, it’s probably a rebound, a breakaway, or a one-timer chance that has a very, very good chance of reaching the net and leaves the goalie with virtually zero time to react.
These are the point blank chances that goalies really earn their money on.
With that in mind, we can track where all of the shots were taken during a given game, where the goals are coming from, and then we can break them into those three categories. Now we have a low danger save percentage, a medium danger save percentage, and a high danger save percentage. From here, we get the real number we’re looking for: Adjusted Save Percentage (AdSv%).
Yet another statistic developed at War-on-Ice, AdSv% determines how good a goalie is based on the success they had stopping more difficult shots by presenting the “weighted-average of SvPctHigh, SvPctMed, and SvPctLow, where the weights correspond to the league-wide percentage of shots from each of those areas.” It’s also calculated at even strength, so goalies aren’t punished for allowing goals on the penalty kill, and it can be further adjusted for score situation, so we can see which goalies thrive in the third period of a tie game by taking away the situations in which their team is either blowing out, or being blown out by their opponents.
This levels the playing field, and breaks down the walls between goalies on good and bad teams to determine who really stands on their head every night. If a goalie allows a goal on a flip in from the blue line, which is the low danger zone, it’ll have a much higher negative impact on their save percentage than a tic-tac-toe goal popped in at the side of the net.
Of course, this metric isn’t perfect. You can easily argue that a clapper taken by Shea Weber that finds its way through traffic is a hell of a lot of difficult to stop than a one-timer shot right in the crease that Alex Ovechkin completely fanned on. But the goalie who pushes away Ovechkin’s lazy slider is rewarded heavily, while the goalie who couldn’t figure out where Weber’s shot was until the red goal light came on is punished. But hey, life isn’t fair sometimes, and we’re just rolling with the averages here. More often than not, a shot from the crease is more difficult to stop than one from the outside wall. That being said, it’s much, much better than just looking at how many saves a goalie made, or how many wins his team managed with he was fortunate enough to be in net.
So, with all that considered, who should win the Vezina Trophy this season?
Holtby’s 0.922 basic save percentage seems good, especially when you also notice his 45-9-4 record this season. But Holtby has had the fortune of playing behind a good team, and as a result, a good chunk of the saves that make up that number come in low danger situations. His 98.04 save percentage from the low danger zone is excellent, but his 92.52 and 84.77 save percentages in medium and high danger zones respectively are just above average. Then, as you would expect, his AdSv% is just average, coming in at 12th in the league at even strength among goalies who have played at least 2,000 minutes.
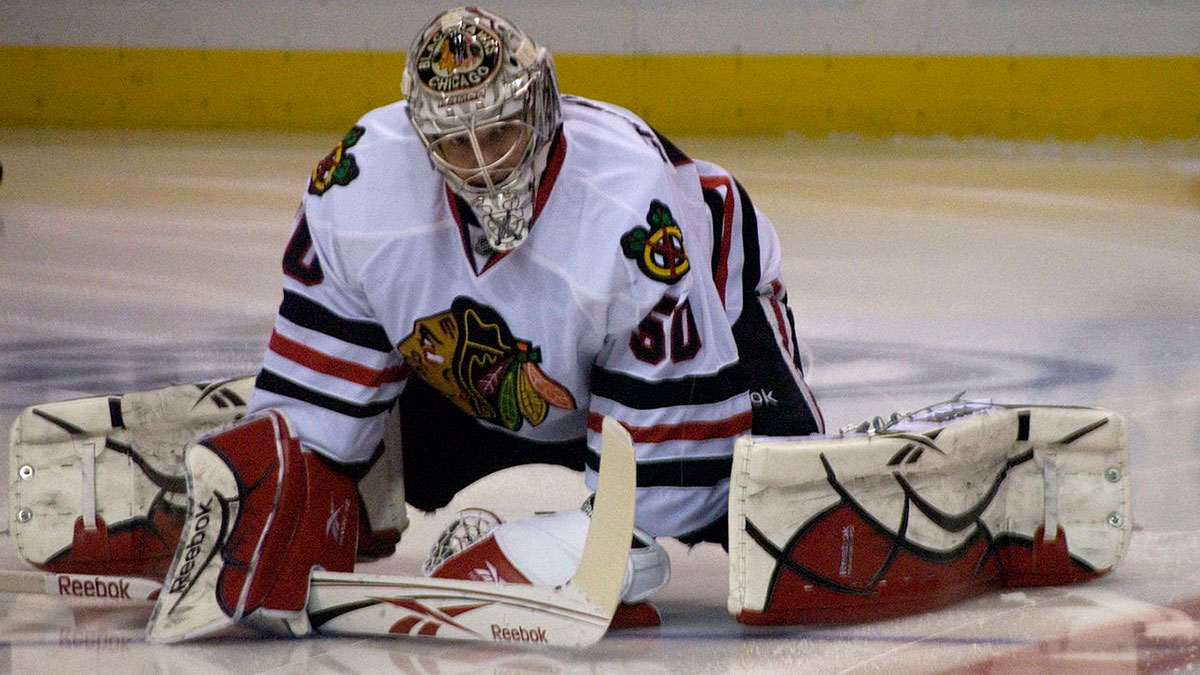
My choice for the Vezina, if I had a vote, would be Corey Crawford of the Chicago Blackhawks. Wait, what? This generation’s version of Chris Osgood? The guy who wins games and Stanley Cups because he’s fortunate enough to play for a dynasty? Yeah, that guy. Despite what you might think, the Hawks haven’t made life easy on Crawford this season.
Nobody in the league faces more shots in the high danger zone than he does (nobody makes more saves on high danger shots than him either), and as a result, he boasts the league’s third highest even strength AdSv% at 93.39. The two goalies who are better, Steve Mason and Henrik Lundqvist, become worse when you adjust for score, meaning Crawford steps him game up even further when in a tight situation. The Hawks’s success can be attributed to Patrick Kane, Jonathan Toews, and Duncan Keith, but this season, Crawford has been just as big a part of it as they have.
Unfortunately for him, come voting time, all of that will be overlooked because he’s a 35-win goalie with a 2.32 goals against average and a 0.926 who plays on an excellent team. Sorry, Corey.


